This is an overview of our Logs & Statistics AddOn for the Responsive Tooltip Glossary plugin for WordPress.
This add-on works with any of the Tooltip Glossary editions including even the free version. This add-on works exclusively with the Tooltip Glossary plugin for WordPress.
This add-on adds a statistical layer to the Tooltip Glossary plugin, providing graphs and follow charts that help you monitor how your users are interacting with your glossary data. This data includes detailed logs of user activity for both logged-in and anonymous users, and their activity on your WordPress site.
This add-on extension to the Tooltip Glossary plugin also comes with an API that connects with a Geo-Location service and translates users IP addresses into country names. This is an important tool for understanding content marketing, user experience and how much the glossary is being used.
July 2026 Offer – For a Limited Time Only:
Get WordPress Tooltip Glossary Plugin for 15% off! Don’t miss out!
The Events Logged with this Logs & Statistics AddOn:
- Tracks clicks on a term page link from any page or post
- Tracks clicks of related terms links from any page or post
- Tracks Tooltip impressions, the number of times a term is hovered-over
- Tracks clicks from links inside the tooltip
The basic log of statistics collected by the add-on can be accessed in the admin dashboard. These logs can be filtered by various events and include both logged in and non logged in users. The images below includes the following data and how the logs work.
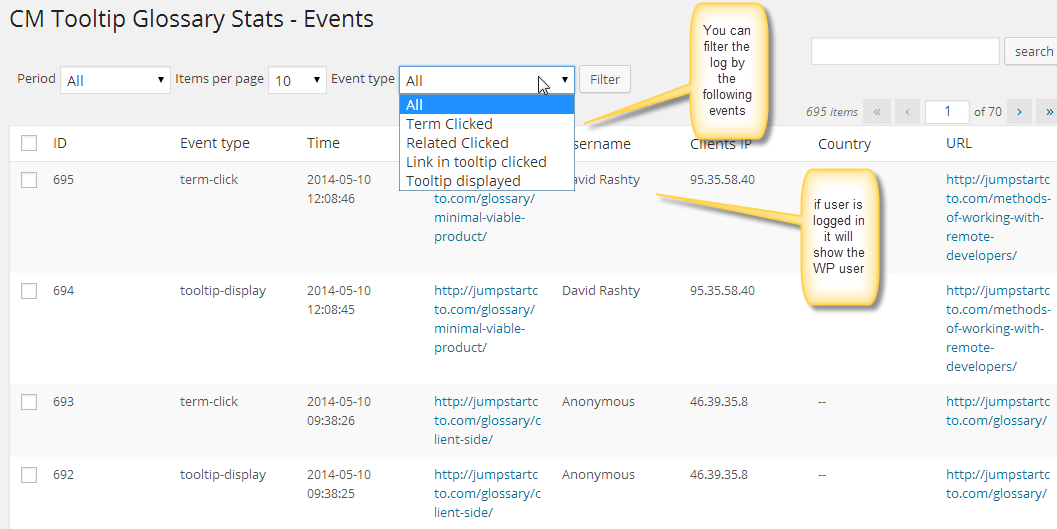
Log file grid
The add-on includes statistical graphs which show how events change over time. These graphs can be filtered by various events or by time frame. The image below shows how the graph will be defined in time period.
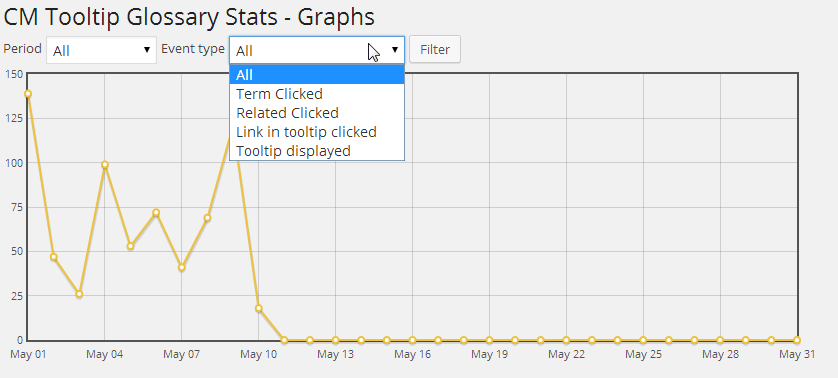
Graph showing All events logged
This Logs & Statistics AddOn is an ideal choice for anyone using the Tooltip Glossary plugin, since it easily keeps track of all statistics without having to track them yourself. The addon covers all clicks and provides detailed logs and graphs for all clicks and users on the website. The logs & statistics can easily be used to improve your overall tooltip glossary.